
Introduction of ER Model
ER Model is used to model the logical view of the system from data perspective which consists of these components:
Entity, Entity Type, Entity Set –
An Entity may be an object with a physical existence – a particular person, car, house, or employee – or it may be an object with a conceptual existence – a company, a job, or a university course.
An Entity is an object of Entity Type and set of all entities is called as entity set. e.g.; E1 is an entity having Entity Type Student and set of all students is called Entity Set. In ER diagram, Entity Type is represented as:

Attribute(s):
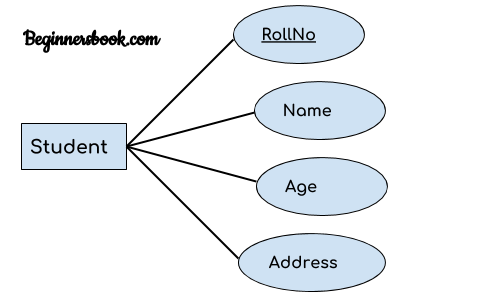
Attributes are the properties which define the entity type. For example, Roll_No, Name, DOB, Age, Address, Mobile_No are the attributes which defines entity type Student. In ER diagram, attribute is represented by an oval.
Attributes are the properties which define the entity type. For example, Roll_No, Name, DOB, Age, Address, Mobile_No are the attributes which defines entity type Student. In ER diagram, attribute is represented by an oval.

- Key Attribute –
The attribute which uniquely identifies each entity in the entity set is called key attribute.For example, Roll_No will be unique for each student. In ER diagram, key attribute is represented by an oval with underlying lines.
- Composite Attribute –
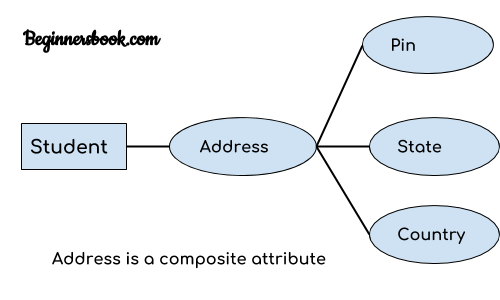
An attribute composed of many other attribute is called as composite attribute. For example, Address attribute of student Entity type consists of Street, City, State, and Country. In ER diagram, composite attribute is represented by an oval comprising of ovals.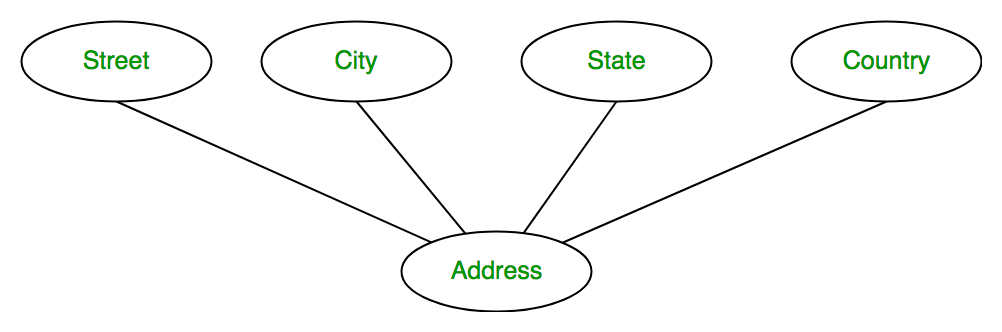
- Multivalued Attribute –
An attribute consisting more than one value for a given entity. For example, Phone_No (can be more than one for a given student). In ER diagram, multivalued attribute is represented by double oval.
- Derived Attribute –
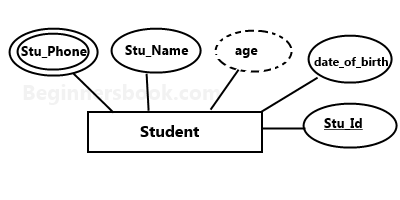
An attribute which can be derived from other attributes of the entity type is known as derived attribute. e.g.; Age (can be derived from DOB). In ER diagram, derived attribute is represented by dashed oval. The complete entity type Student with its attributes can be represented as:
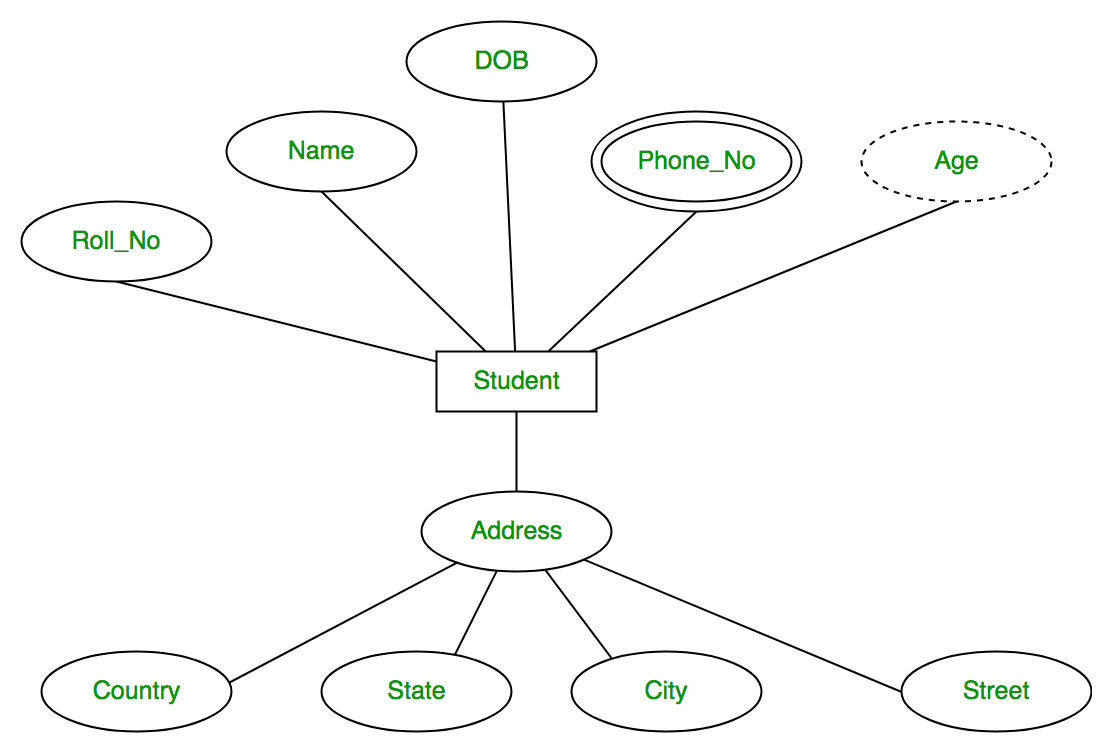
Relationship Type and Relationship Set:
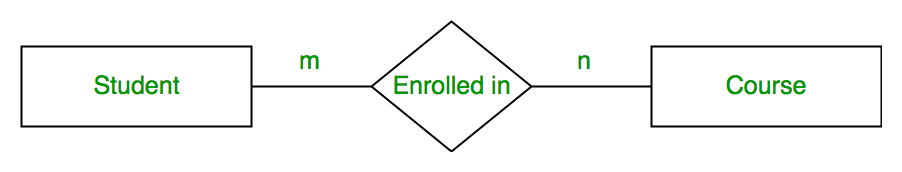
A relationship type represents the association between entity types. For example,‘Enrolled in’ is a relationship type that exists between entity type Student and Course. In ER diagram, relationship type is represented by a diamond and connecting the entities with lines.
A relationship type represents the association between entity types. For example,‘Enrolled in’ is a relationship type that exists between entity type Student and Course. In ER diagram, relationship type is represented by a diamond and connecting the entities with lines.
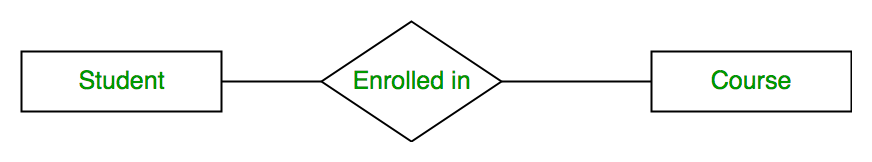
A set of relationships of same type is known as relationship set. The following relationship set depicts S1 is enrolled in C2, S2 is enrolled in C1 and S3 is enrolled in C3.

Degree of a relationship set:
The number of different entity sets participating in a relationship set is called as degree of a relationship set.
The number of different entity sets participating in a relationship set is called as degree of a relationship set.
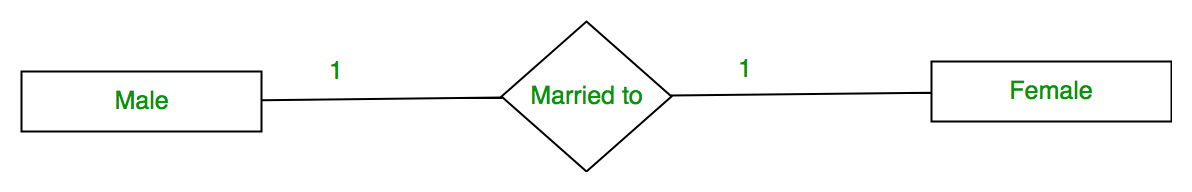
- Unary Relationship –
When there is only ONE entity set participating in a relation, the relationship is called as unary relationship. For example, one person is married to only one person.
- Binary Relationship –
When there are TWO entities set participating in a relation, the relationship is called as binary relationship.For example, Student is enrolled in Course. - n-ary Relationship –
When there are n entities set participating in a relation, the relationship is called as n-ary relationship.
Cardinality:
The number of times an entity of an entity set participates in a relationship set is known as cardinality. Cardinality can be of different types:
The number of times an entity of an entity set participates in a relationship set is known as cardinality. Cardinality can be of different types:
- One to one – When each entity in each entity set can take part only once in the relationship, the cardinality is one to one. Let us assume that a male can marry to one female and a female can marry to one male. So the relationship will be one to one.
 Using Sets, it can be represented as:
- Many to one – When entities in one entity set can take part only once in the relationship set and entities in other entity set can take part more than once in the relationship set, cardinality is many to one. Let us assume that a student can take only one course but one course can be taken by many students. So the cardinality will be n to 1. It means that for one course there can be n students but for one student, there will be only one course.
 Using Sets, it can be represented as:
 In this case, each student is taking only 1 course but 1 course has been taken by many students.
 - Many to many – When entities in all entity sets can take part more than once in the relationship cardinality is many to many. Let us assume that a student can take more than one course and one course can be taken by many students. So the relationship will be many to many.
 Using sets, it can be represented as:
 In this example, student S1 is enrolled in C1 and C3 and Course C3 is enrolled by S1, S3 and S4. So it is many to many relationships.
Participation Constraint:
Participation Constraint is applied on the entity participating in the relationship set.
Participation Constraint is applied on the entity participating in the relationship set.
- Total Participation – Each entity in the entity set must participate in the relationship. If each student must enroll in a course, the participation of student will be total. Total participation is shown by double line in ER diagram.
- Partial Participation – The entity in the entity set may or may NOT participate in the relationship. If some courses are not enrolled by any of the student, the participation of course will be partial.The diagram depicts the ‘Enrolled in’ relationship set with Student Entity set having total participation and Course Entity set having partial participation.
 Using set, it can be represented as,
 Every student in Student Entity set is participating in relationship but there exists a course C4 which is not taking part in the relationship.
Weak Entity Type and Identifying Relationship:
As discussed before, an entity type has a key attribute which uniquely identifies each entity in the entity set. But there exists some entity type for which key attribute can’t be defined. These are called Weak Entity type.
As discussed before, an entity type has a key attribute which uniquely identifies each entity in the entity set. But there exists some entity type for which key attribute can’t be defined. These are called Weak Entity type.
For example, A company may store the information of dependants (Parents, Children, Spouse) of an Employee. But the dependents don’t have existence without the employee. So Dependent will be weak entity type and Employee will be Identifying Entity type for Dependant.
A weak entity type is represented by a double rectangle. The participation of weak entity type is always total. The relationship between weak entity type and its identifying strong entity type is called identifying relationship and it is represented by double diamond.

Entity Relationship Diagram – ER Diagram in DBMS
An Entity–relationship model (ER model) describes the structure of a database with the help of a diagram, which is known as Entity Relationship Diagram (ER Diagram). An ER model is a design or blueprint of a database that can later be implemented as a database. The main components of E-R model are: entity set and relationship set.
What is an Entity Relationship Diagram (ER Diagram)?
An ER diagram shows the relationship among entity sets. An entity set is a group of similar entities and these entities can have attributes. In terms of DBMS, an entity is a table or attribute of a table in database, so by showing relationship among tables and their attributes, ER diagram shows the complete logical structure of a database. Lets have a look at a simple ER diagram to understand this concept.
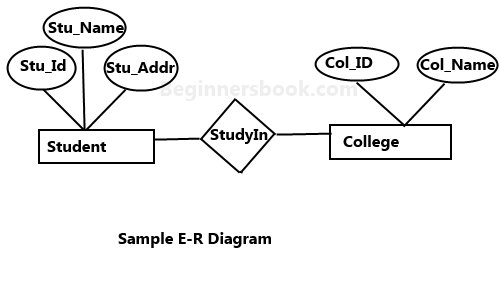
A simple ER Diagram:
In the following diagram we have two entities Student and College and their relationship. The relationship between Student and College is many to one as a college can have many students however a student cannot study in multiple colleges at the same time. Student entity has attributes such as Stu_Id, Stu_Name & Stu_Addr and College entity has attributes such as Col_ID & Col_Name.
Here are the geometric shapes and their meaning in an E-R Diagram. We will discuss these terms in detail in the next section(Components of a ER Diagram) of this guide so don’t worry too much about these terms now, just go through them once.
Rectangle: Represents Entity sets.
Ellipses: Attributes
Diamonds: Relationship Set
Lines: They link attributes to Entity Sets and Entity sets to Relationship Set
Double Ellipses: Multivalued Attributes
Dashed Ellipses: Derived Attributes
Double Rectangles: Weak Entity Sets
Double Lines: Total participation of an entity in a relationship set
Components of a ER Diagram

As shown in the above diagram, an ER diagram has three main components:
1. Entity
2. Attribute
3. Relationship
1. Entity
An entity is an object or component of data. An entity is represented as rectangle in an ER diagram.
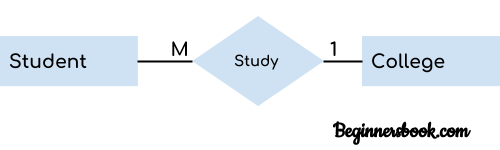
For example: In the following ER diagram we have two entities Student and College and these two entities have many to one relationship as many students study in a single college. We will read more about relationships later, for now focus on entities.
For example: In the following ER diagram we have two entities Student and College and these two entities have many to one relationship as many students study in a single college. We will read more about relationships later, for now focus on entities.
Weak Entity:
An entity that cannot be uniquely identified by its own attributes and relies on the relationship with other entity is called weak entity. The weak entity is represented by a double rectangle. For example – a bank account cannot be uniquely identified without knowing the bank to which the account belongs, so bank account is a weak entity.
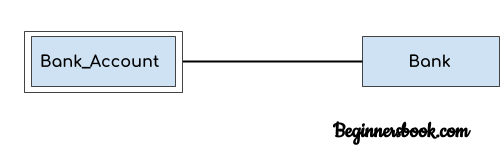
An entity that cannot be uniquely identified by its own attributes and relies on the relationship with other entity is called weak entity. The weak entity is represented by a double rectangle. For example – a bank account cannot be uniquely identified without knowing the bank to which the account belongs, so bank account is a weak entity.
2. Attribute
An attribute describes the property of an entity. An attribute is represented as Oval in an ER diagram. There are four types of attributes:
1. Key attribute
2. Composite attribute
3. Multivalued attribute
4. Derived attribute
2. Composite attribute
3. Multivalued attribute
4. Derived attribute
1. Key attribute:
A key attribute can uniquely identify an entity from an entity set. For example, student roll number can uniquely identify a student from a set of students. Key attribute is represented by oval same as other attributes however the text of key attribute is underlined.
2. Composite attribute:
An attribute that is a combination of other attributes is known as composite attribute. For example, In student entity, the student address is a composite attribute as an address is composed of other attributes such as pin code, state, country.
3. Multivalued attribute:
An attribute that can hold multiple values is known as multivalued attribute. It is represented with double ovals in an ER Diagram. For example – A person can have more than one phone numbers so the phone number attribute is multivalued.
4. Derived attribute:
A derived attribute is one whose value is dynamic and derived from another attribute. It is represented by dashed oval in an ER Diagram. For example – Person age is a derived attribute as it changes over time and can be derived from another attribute (Date of birth).
E-R diagram with multivalued and derived attributes:
3. Relationship
A relationship is represented by diamond shape in ER diagram, it shows the relationship among entities. There are four types of relationships:
1. One to One
2. One to Many
3. Many to One
4. Many to Many
1. One to One
2. One to Many
3. Many to One
4. Many to Many
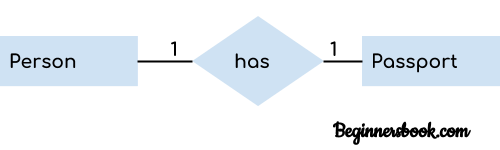
1. One to One Relationship
When a single instance of an entity is associated with a single instance of another entity then it is called one to one relationship. For example, a person has only one passport and a passport is given to one person.
2. One to Many Relationship
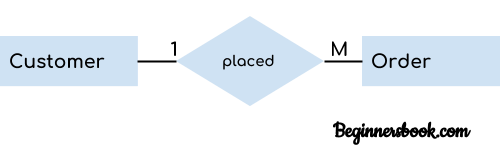
When a single instance of an entity is associated with more than one instances of another entity then it is called one to many relationship. For example – a customer can place many orders but a order cannot be placed by many customers.
3. Many to One Relationship
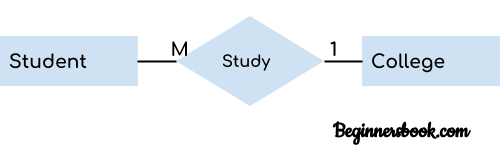
When more than one instances of an entity is associated with a single instance of another entity then it is called many to one relationship. For example – many students can study in a single college but a student cannot study in many colleges at the same time.
4. Many to Many Relationship
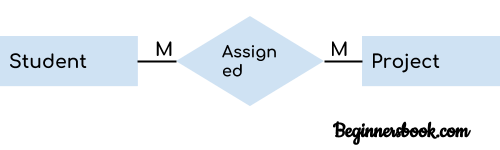
When more than one instances of an entity is associated with more than one instances of another entity then it is called many to many relationship. For example, a can be assigned to many projects and a project can be assigned to many students.
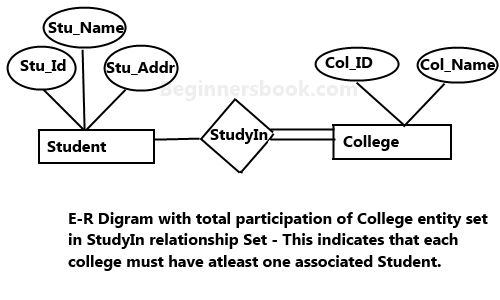
Total Participation of an Entity set
A Total participation of an entity set represents that each entity in entity set must have at least one relationship in a relationship set. For example: In the below diagram each college must have at-least one associated Student.
No comments:
Post a Comment